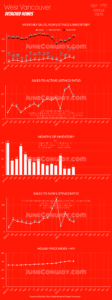
Though West Vancouver house April sale activity was down -18% from the month before, sale totals were up +280% from April last year and +35% above the 10-year monthly average!
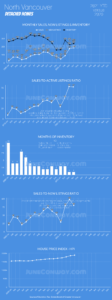
North Vancouver total reported sales in April were up +4% from March, up an astronomical +381% from same month last year and up +212% above the 10-year monthly average.
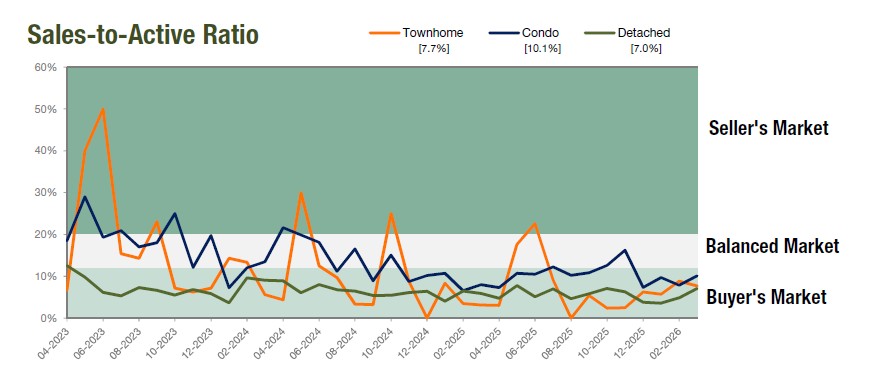
For more market trend details regarding inventory, new listings, prices, sales-to-new listing ratio, sales-to-active listings ratio, and months of inventory, check out the infographics prepared for West Vancouver and North Vancouver.
If you’re concerned about making the decision to buy or sell right now, reach out to discuss what’s happening in your local market:
June Conway
[email protected]