







This September, slower apartment sales brought overall home sales down in Metro Vancouver.
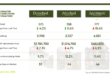
Realtors registered over 1,700 residential home sales in September, an 8% decrease from last year and 25% below the 10-year average for the month. With detached and attached home sales up slightly from last September, the overall decline was driven mainly by lower apartment sales.
Realtors also new listed nearly 5,900 properties in September, a 10% decrease from this time last year and nearly 6% above the 10-year average for the month. September finished with about 16,400 homes listed for sale on the MLS, a 4% decrease from last September, but still more than 24% above the 10-year seasonal average.
To get a better understanding of supply and demand, we use the sales to active listings ratio. This ratio measures the number of homes available for sale against the number of homes sold throughout the month to get an idea of supply and demand. Analysis of historical data suggests downward pressure on home prices occurs when this ratio dips below 12% for a sustained period. Home prices often experience upward pressure when it surpasses 20% over several months. September ended with this ratio at 11%. By property type, the ratio is 10% for detached, 12% for attached, and 11% for apartments.
The MLS HPI benchmark price for all housing types in Metro Vancouver in September sits at about $1,076,000, down5.5% from last year. By property type, detached homes are at a benchmark price of $1,785,000. Townhomes at about $1,017,000 and apartments at about $683,000. These numbers suggest families and people buying homes to live in are driving the market. While investors are largely waiting for more favorable conditions. We’re also seeing several months of small price declines add up with benchmark prices across most market segments now down about 3% since the start of the year.